Debugging Alfresco is not always a simple undertaking. Remote Debugger features of common IDEs allow remote debugging of Java-based components, but for JavaScript and FreeMarker templates things are not as simple as they could be.
While the Rhino engine embedded in Alfresco comes with an own integrated Debugger, there is no such thing for FreeMarker as far as I know. But even the embedded Rhino Debugger is everything but feature complete. On the one hand it represents another break in the already extensive tool chain and on the other it can only be used on servers that come with a graphical user interface. Debugging of development or test environments on headless servers or VMs is not possible. I’ve recently taken the time to check out the new JavaScript Debugger features of the Eclipse JavaScript Development Tools (JSDT) project.
Starting in version 3.7 of the Eclipse IDE the essential components of the JSDT are part of every distribution which includes the Web Standard Tools sub project. After some initial problems with the not fully matured Debugger component I switched to milestone 4 of the upcoming Juno release for my tests. The project’s wiki has a rather useful guide for using the Rhino Debugger support as well as our special use case of integrating with an embedded Rhino Engine. A small FAQ for the most common problems is available as well.
In order to remote debug the JavaScript code of web scripts and the like using Eclipse, a special debug component has to run within the Alfresco server and listen on a TCP port for incoming debug communication (see the Java Platform Debugger Architecture). The JSDT provides the necessary JARs as part of its plugins, so we only have to copy them into <tomcat>/webapps/alfresco/WEB-INF/lib (due to a class dependency on the Rhino engine, <tomcat>/shared/lib is not an option). Those libraries are:
- org.eclipse.wst.jsdt.debug.rhino.debugger_<version>.jar
- org.eclipse.wst.jsdt.debug.transport_<version>.jar
Based on the guide for debugging an embedded script engine, the server component has to be bound to a Rhino runtime context and activated. This requires implementing a simple bootstrap bean and including it in the web application startup via Spring.
package com.prodyna.debug.rhino; import java.text.MessageFormat; import org.eclipse.wst.jsdt.debug.rhino.debugger.RhinoDebugger; import org.mozilla.javascript.ContextFactory; import org.springframework.beans.factory.InitializingBean; public class RemoteJSDebugInitiator implements InitializingBean { private static final int DEFAULT_PORT = 9000; private static final String DEFAULT_TRANSPORT = "socket"; private boolean suspend = false; // suspend until debugger attaches itself private boolean trace = false; // trace-log the debug agent private int port = DEFAULT_PORT; private String transport = DEFAULT_TRANSPORT; // the global context factory used by Alfresco private ContextFactory contextFactory = ContextFactory.getGlobal(); public void afterPropertiesSet() throws Exception { // setup debugger based on configuration final String configString = MessageFormat.format( "transport={0},suspend={1},address={2},trace={3}", new Object[] { this.transport, this.suspend ? "y" : "n", String.valueOf(this.port), this.trace ? "y" : "n" }); final RhinoDebugger debugger = new RhinoDebugger(configString); this.contextFactory.addListener(debugger); debugger.start(); } public void setSuspend(boolean suspend) { this.suspend = suspend; } public void setTrace(boolean trace) { this.trace = trace; } public void setPort(int port) { this.port = port; } public void setTransport(String transport) { this.transport = transport; } public void setContextFactory(ContextFactory contextFactory) { this.contextFactory = contextFactory; } } |
The following bean delcaration in <tomcat>/shared/classes/alfresco/extension/dev-context.xml activates the bean.
<bean id="pd.jsRemoveDebugger" class="com.prodyna.debug.rhino.RemoteJSDebugInitiator"> <property name="port"><value>8000</value></property> <property name="trace"><value>true</value></property> </bean> |
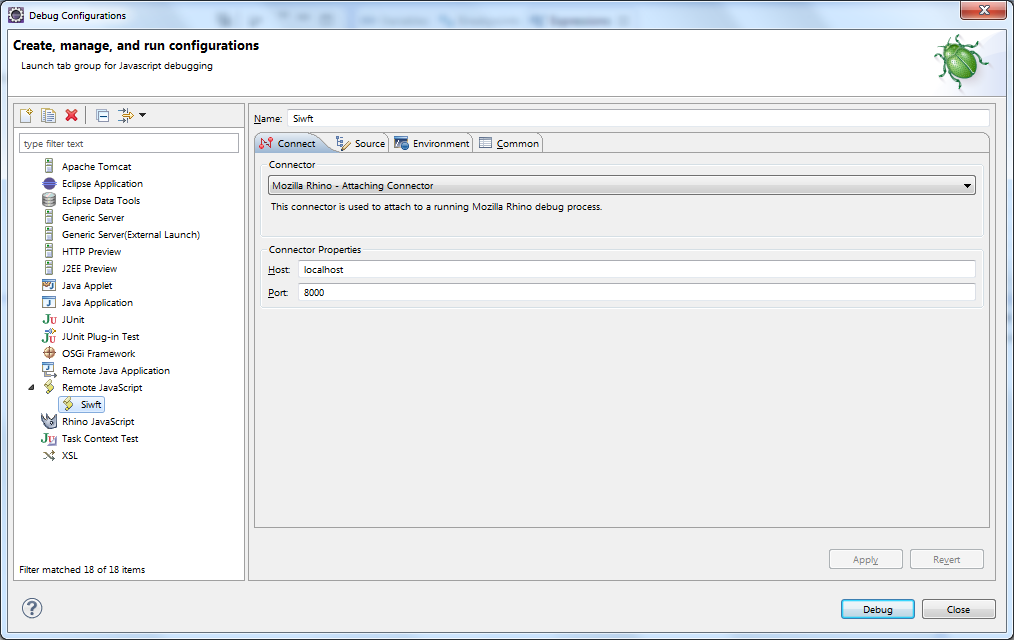
After restarting the Alfresco Repository server Eclipse can connect to the Rhino engine using the JavaScript debugger. The parameters used in the activation bean – wether default or customized – need to be provided in the debug configuration, using the Mozilla Rhino Attaching Connector.
Unfortunately that is not yet enough to successfully debug server side JavaScript from within Eclipse. Similar to the classpath for Java source code, JavaScript files need to reside in a specific structure for Eclipse to be able to associate them with scripts being executed by the server engine. Only if this association can be made are breakpoints set in JavaScript source code actually being transmitted to and evaluated by the server side debugger component.
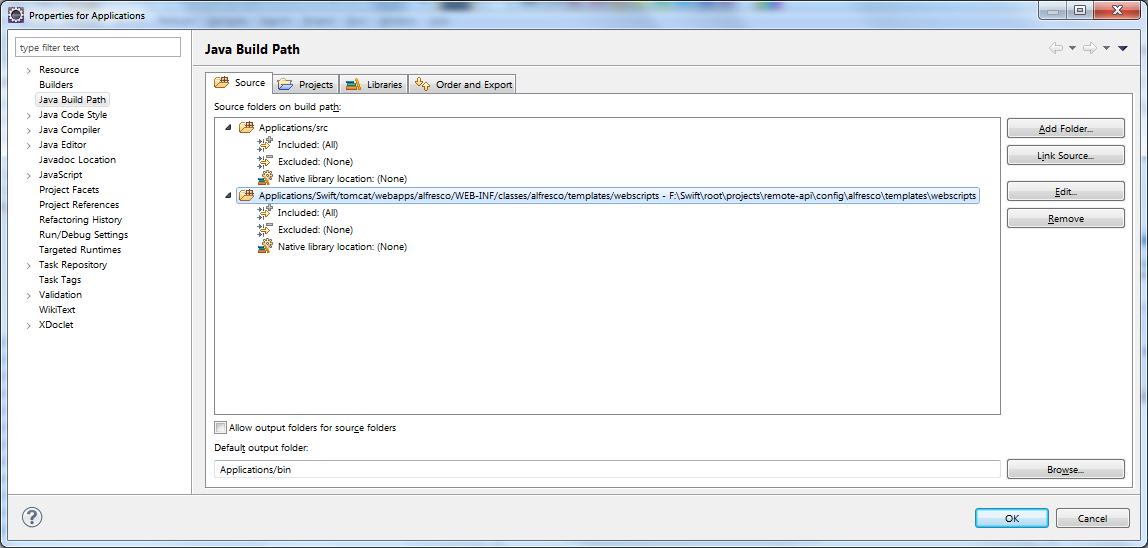
The expected source code structure for remote debuggable scripts is dependent on the source name used when executing scripts with the Rhino engine. Alfresco refers to the file URI of the main script, i.e. in a repository server set up under “D:\Applications\Swift\tomcat” the URI for the web script controller sites.get.js is “file://D:/Applications/Swift/tomcat/webapps/alfresco/WEB-INF/classes/alfresco/templates/webscripts/org/alfresco/repository/sites/sites.get.js”. Such a URI is mapped without the “file://D:/” prefix to a automatically created source project “External JavaScript Source” according to the FAQ of JSDT. That did not work for and after studying the source code of the JSDT plugin I found a working alternative: with the first path fragment referring to a specific source code project, the remainder of the path is used for code lookup relativ to that project.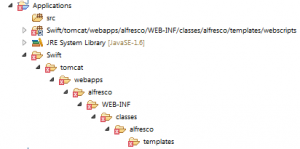 In order to debug a JavaScript web script controller of my Swift repository server, those web scripts had to be made available in a project called “Applications” and a subfolder structure “Swift/t/tomcat/webapps/alfresco/WEB-INF/classes/alfresco/templates/webscripts/”. The simplest way to do this is linking the source code of the Remote API project into such a structure instead of duplicating it.
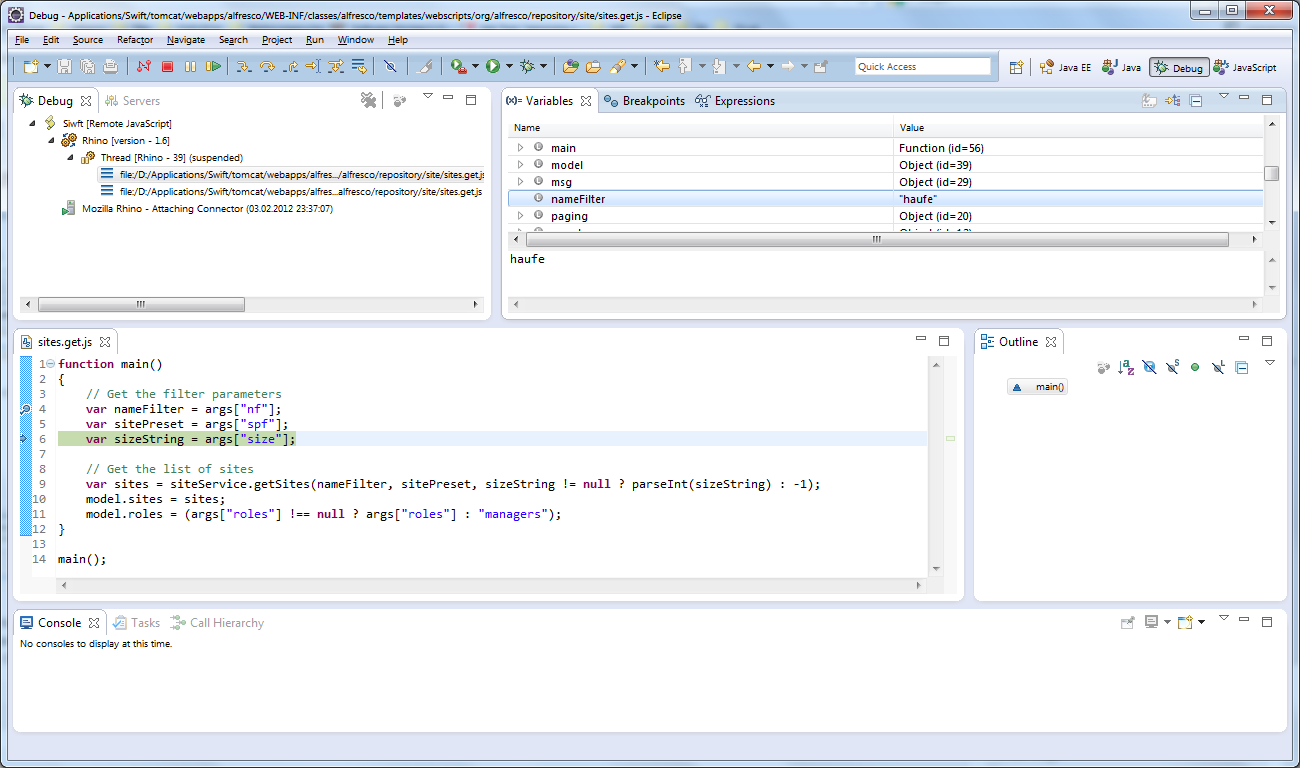
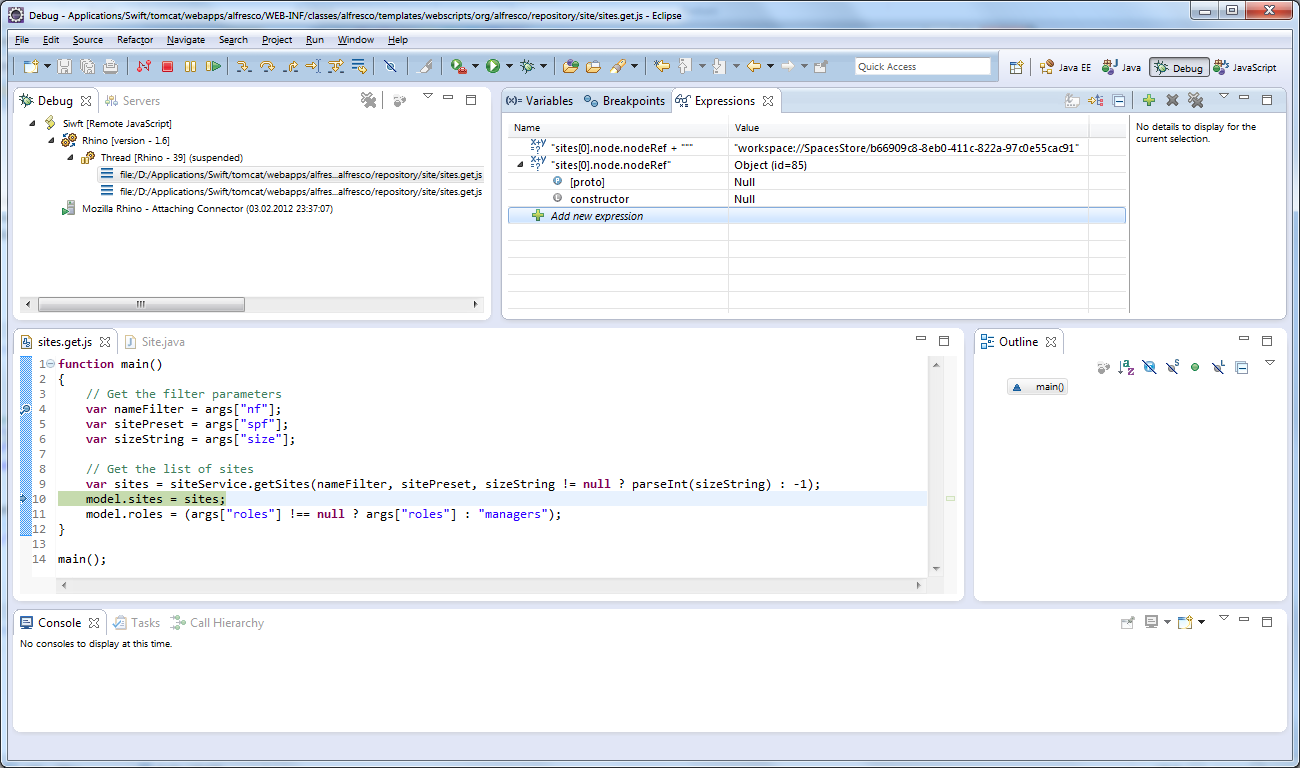
Having complete the last piece of configuration, breakpoints set in Alfresco web scripts like sites.get.js will now be properly transmitted to and activated on the server. On the next execution of a site search from within Alfresco Share, the debugger will pause at the specified code line. Standard features like step over / iunto, variables and expression views are available to investigate the behavior of the selected script. Especially the expressions view is currently of utmost importance as the debugger is not yet able to handle Java objects as variable values unless they are transformed into native JavaScript instances via an expression.
Mid-term review: The Eclipse JSDT allows debugging of JavaScript scripts that are part of the Alfresco application – i.e. lying in its classpath – from within the familiar IDE used by a majority of Alfresco developers. This eliminates the previous restrictions imposed by the Rhino Debugger which only allowed debugging on servers that were either local or sported a graphical user interface. Setting up the JSDT remote debugger takes some getting used to but should be easy to handle with the tools provided by the IDE, such as source linking. Currently there are some functional limitations and peculiarities due to the yet not matured debugger and the way the Rhino engine is embedded within Alfresco. I will address some of these issues in upcoming posts of this new blog series and provide solutions where possible.
 German
Hallo Herr Faust,
danke für diesen Beitrag! Ich würde vorschlagen, diesen Beitrag direkt an Alfresco weiterzuleiten, so dass der Debugging-Support Standard in Alfresco 4.x werden kann und z.B. per einfacher Konfiguration und Kopieren der Eclipse-Bibliotheken aktiviert werden kann.
Danke und viele Grüße,
Jens Goldhammer
Hallo Axel,
the rhino embedded debugger definitely has its drawbacks, and uniform debugging even providing more features !) surely is something we should aim at.
This is all pretty much bleeding edge today. Thats fine with me in general, although I don’t want to try eclipse milestones or snapshots for day to day work.
I really appreciate reading your experiences, and I’m curious how this will all work out.
I see a few hurdles ahead before this can go “mainstream”.
Debugging (rhino) server side javascript in the alfresco world applies to surf apps (such as share) as well. Should not be a big deal getting this all to work in the surf environment I guess.
I don’t know much about the debugging protocol used and how it depends on rhino or eclipse. Not everybody is using eclipse (I do), and alfresco may choose to replace rhino with nashorn one day.
cheers
Andreas
Hi Andreas,
I agree, Milestones / Snapshots are not practical for regular usage – but the stable Juno will be released in June this year so this will be available to the general developer pretty soon. This is my current pet project and I will be looking into expanding this to the Surf layer as well as providing an alternative import mechanism for JavaScript – the current one produces a ton of syntax errors and scripts using it can effectively not be properly debugged.
The debug transport protocol is a generic JSON based-format that is not dependant on Rhino or Eclipse. Should Alfresco switch to Nashorn – and I figure this is yet a very long way in the future (when JDK 8 actually has become the major version used in production by customers) – only the adapter to the engine should need to change. But I’d assume before other IDEs reuse the transport protocol and engine adapter of Eclipse, they’d be developing their own.
Regards, Axel
Hi Axel,
please replace the import “tag” with a library call.
In fact, this is bugging me far more than the embedded debugger.
You may want to have a look at:
http://code.google.com/p/share-extras/issues/detail?id=64
http://stackoverflow.com/questions/8124906/alfresco-debugger-cannot-open-js-including-an-import-tag/8799964
cheers
Andreas
Hi Axel, the import syntax is something I also looked into recently with the Javascript Console. You would have to overwrite the whole RhinoScriptProcessor to change the import, since the actual String replacement is done in a static helper
I think it’s best to use a simple node.js style require(“somescript.js”) command and parse it the same way as the current xml import statements are parsed before script compilation.
To have support for AMD (https://github.com/amdjs/amdjs-api/wiki/AMD) style module definitions would be nice but I don’t think it’s practical with the way scripts are executed in Alfresco.
Hi Florian,
having a API library function is what I am aiming for too. In my first approach I dove into the RhinoScriptProcessor and changed the way import-tags are handled, the two major changes being that scripts would no longer be merged but simply executed in sequence and the import tag could be in a line comment at the start of the file, thus no longer messing up syntax validation. The changes were actually not that extensive as I first believed they would be. We’ll see how much hassle implementing a library function entails – I hope to get around to doing this within the next two weeks…